Day 6: Evaluation Metrics — How Do We Know a Model is Good
Day 6: Evaluation Metrics — How Do We Know a Model is Good
 Parathan Thiyagalingam
We have casually used "accuracy" and "R²" for the last two days without thinking too carefully about them. Today we take that question seriously. Picking the wrong metric is one of the silent killers of ML projects, because it can quietly let a bad model look great or a great model look bad. Every interviewer has favourite metric questions, and today is the day to nail them.
This blog post is a daily learning summary of my ML self-study.
Terms Used Today
- MAE / MSE / RMSE / R²: Regression metrics. Different ways to measure how wrong our number predictions are.
- Confusion matrix: A 2×2 table of True Positives, False Positives, True Negatives, and False Negatives. The parent of every classification metric.
- Accuracy: Fraction of predictions that are correct (warning: lies on imbalanced data).
- Precision: "When the model says yes, how often is it right?"
- Recall: "Of all the real yeses, how many did the model catch?"
- F1 score: The harmonic mean of precision and recall.
- ROC-AUC: A threshold-independent score for how well the model ranks positives above negatives.
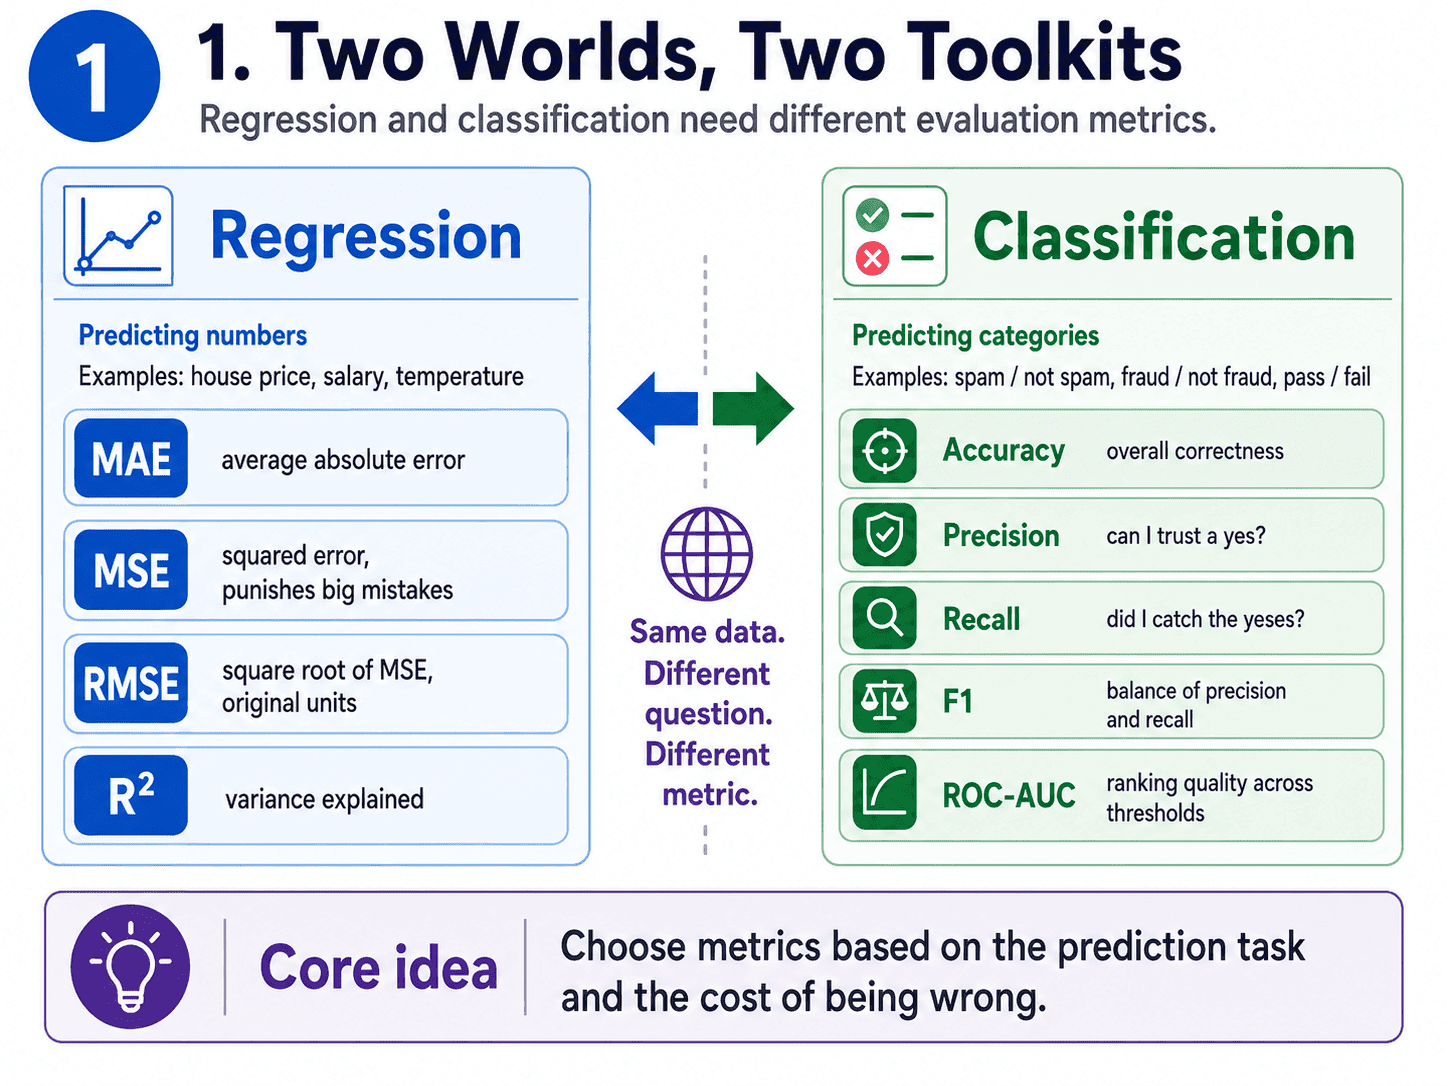
1. Two Worlds, Two Toolkits:
Regression and classification need different metrics.
Same model, same data, but a different question on the test paper.
- Regression (predicting numbers): use MAE, MSE, RMSE, R².
- Classification (predicting categories): use accuracy, precision, recall, F1, ROC-AUC.
Let us walk through each, starting with regression.
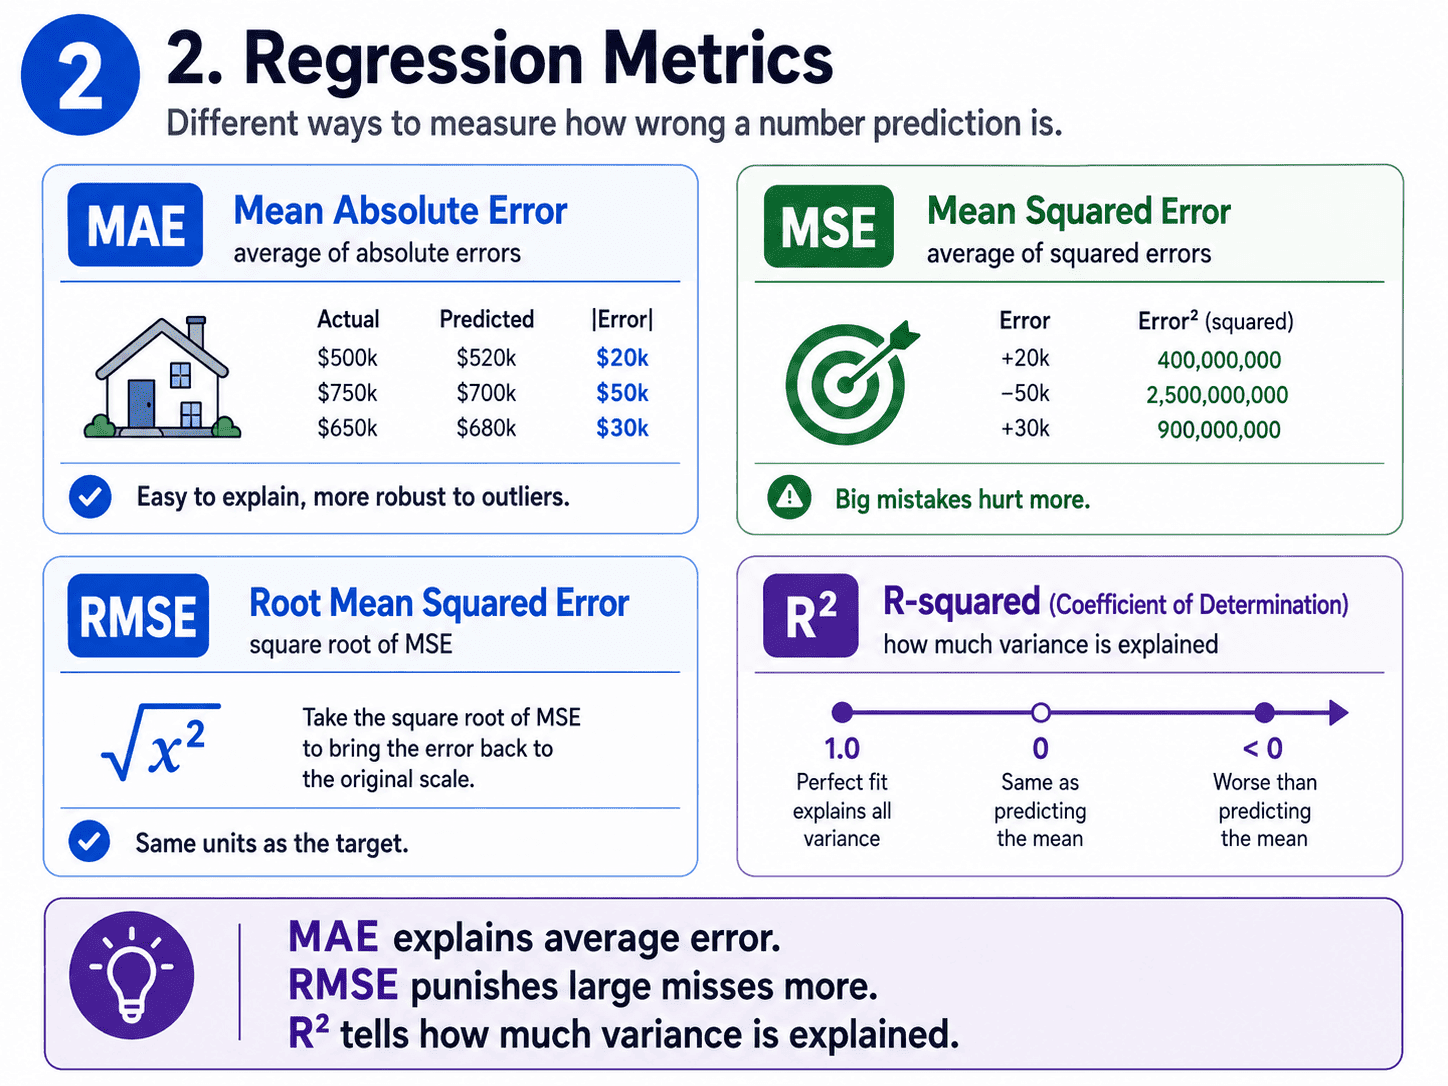
2. Regression Metrics:
MAE (Mean Absolute Error). The average of absolute differences between predicted and actual.
MAE = average of |actual − predicted|
For example, if we are predicting house prices and our MAE is $12,000, that means on average our predictions are off by $12k.
Easy to explain. Robust to outliers, because one bad row does not blow up the score.
MSE (Mean Squared Error). The one Linear Regression itself minimises.
MSE = average of (actual − predicted)²
Squaring punishes big mistakes harder.
A $50k miss counts much more than five $10k misses. Mathematically clean to optimise, but sensitive to outliers because of the squaring.
RMSE (Root Mean Squared Error). Take the square root of MSE so the units come back to the original scale (dollars, kilograms, etc.).
RMSE = √MSE
This is the most commonly reported metric in industry.
Like MAE in spirit, but punishes large errors more.
R² (Coefficient of Determination). A score (usually between 0 and 1) telling us how much of the variance in y our model explains.
- R² = 1.0 is perfect predictions.
- R² = 0 is no better than always predicting the average.
- R² < 0 is worse than that. Yes, this is possible if the model is genuinely bad.
When we say "my model has R² = 0.85," it means the model explains 85% of the variation in the target. Useful for comparison across problems since R² is scale-free.
3. Classification Metrics:
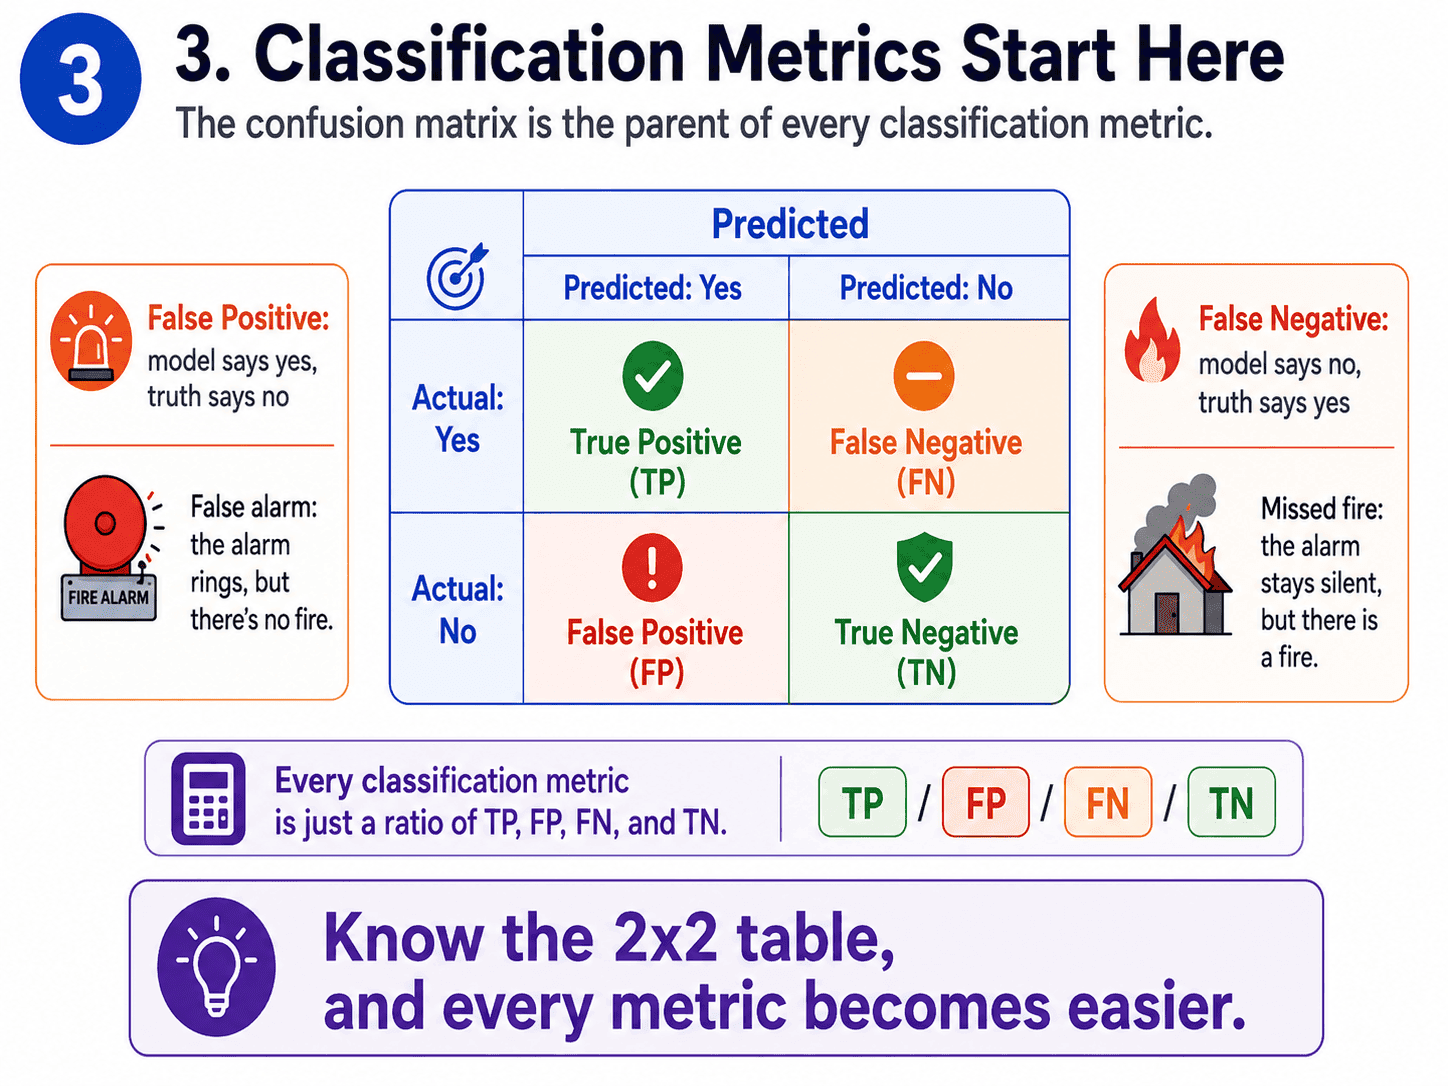
Before any classification metric, we need this 2×2 table.
| Predicted: Yes | Predicted: No | |
|---|---|---|
| Actual: Yes | True Positive (TP) | False Negative (FN) |
| Actual: No | False Positive (FP) | True Negative (TN) |
Every classification metric is just some ratio of those four numbers. Once we have this picture, every metric becomes obvious.
Two failure modes worth naming clearly.
- False Positive (FP): Model says yes, truth says no. The fire alarm goes off when there is no fire.
- False Negative (FN): Model says no, truth says yes. The fire alarm stays silent during an actual fire.
Different problems care about different failures. That is the whole reason multiple metrics exist.
4. Accuracy and Its Trap:
Accuracy = (TP + TN) / total
What fraction did we get right overall? Sounds great, but it lies on imbalanced data. If 99% of emails are not spam, a model that just says "not spam" to everything gets 99% accuracy and is useless. We will dedicate [[Day 11 Class Imbalance — Why Accuracy Lies|Day 11]] to this trap.
5. A Worked Example to Anchor the Numbers:
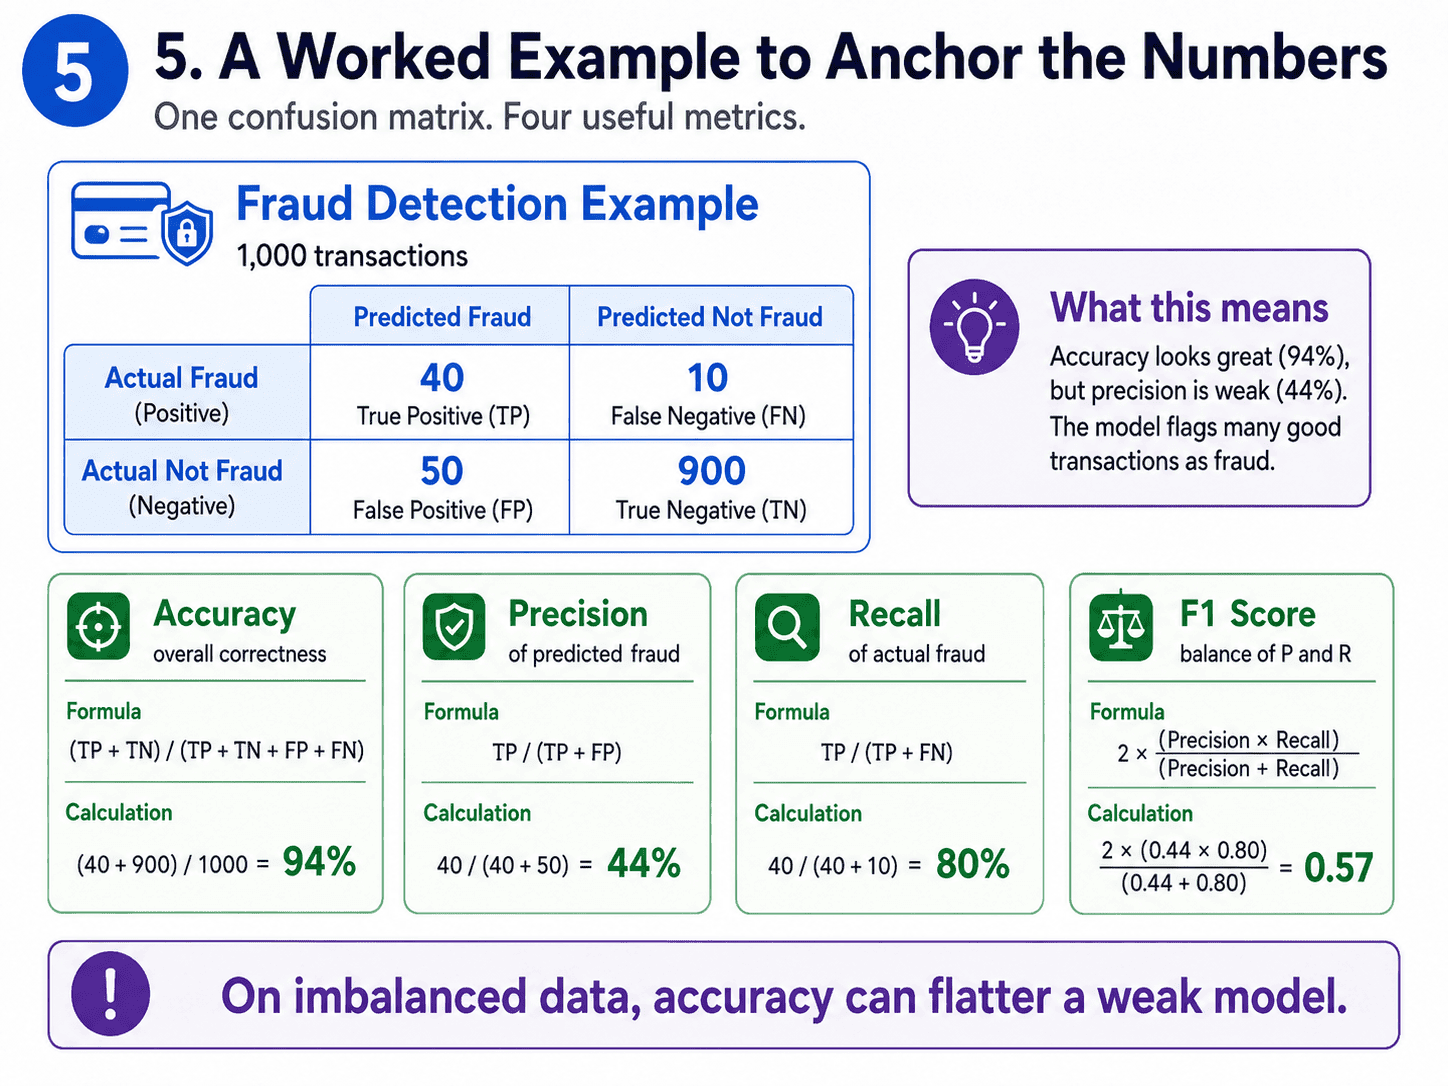
Let us pin all this down with a tiny concrete example. Imagine a fraud detector evaluated on 1,000 transactions.
| Predicted: Fraud | Predicted: Not Fraud | |
|---|---|---|
| Actual: Fraud | 40 (TP) | 10 (FN) |
| Actual: Not Fraud | 50 (FP) | 900 (TN) |
From this single table, every classification metric falls out.
- Accuracy = (40 + 900) / 1000 = 94%. Sounds great, but…
- Precision = 40 / (40 + 50) = 44%. Of all the times we cried fraud, less than half were real.
- Recall = 40 / (40 + 10) = 80%. We caught 80% of actual fraud cases.
- F1 = 2 × (0.44 × 0.80) / (0.44 + 0.80) = 0.57.
Accuracy and F1 disagree because the data is imbalanced. F1 is the more honest number here.
6. Precision and Recall:
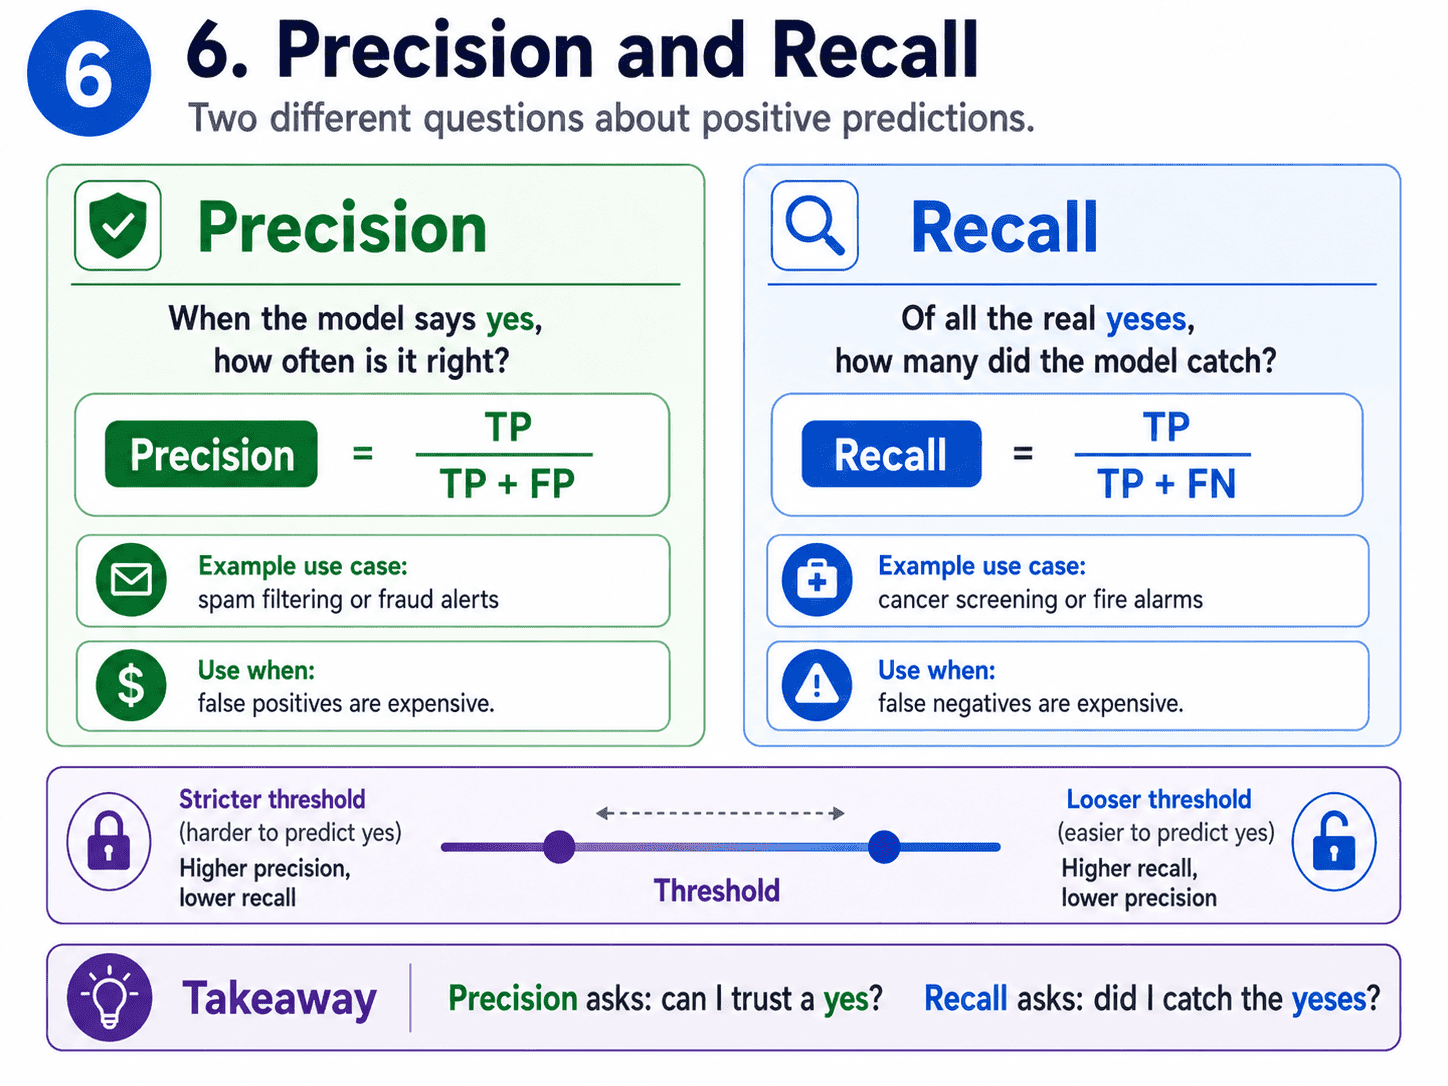
Precision: "When my model says yes, can I trust it?"
Precision = TP / (TP + FP)
Of everything we predicted positive, what fraction was actually positive?
Use precision when false positives are expensive.
For example, a spam filter (we do not want real emails going to the spam folder), or marking customers as fraud (false accusations are bad).
Recall (also called sensitivity): "How much of the truth did my model find?"
Recall = TP / (TP + FN)
Of everything that was actually positive, how much did we catch?
Use recall when false negatives are expensive. For example, cancer screening (missing a real case is catastrophic), or fire alarms (missing real fires is unacceptable).
Precision asks: can I trust a yes?
Recall asks: did I catch all the yeses?
7. The Precision-Recall Tradeoff:
Push the model to be more strict about saying "yes" → precision goes up, recall goes down.
Loosen it up → recall goes up, precision goes down.
We usually cannot max both at the same time. The threshold from yesterday's Day 5 Logistic Regression — When the Answer is Yes or No is exactly the dial we turn to move along this tradeoff.
8. F1 Score:
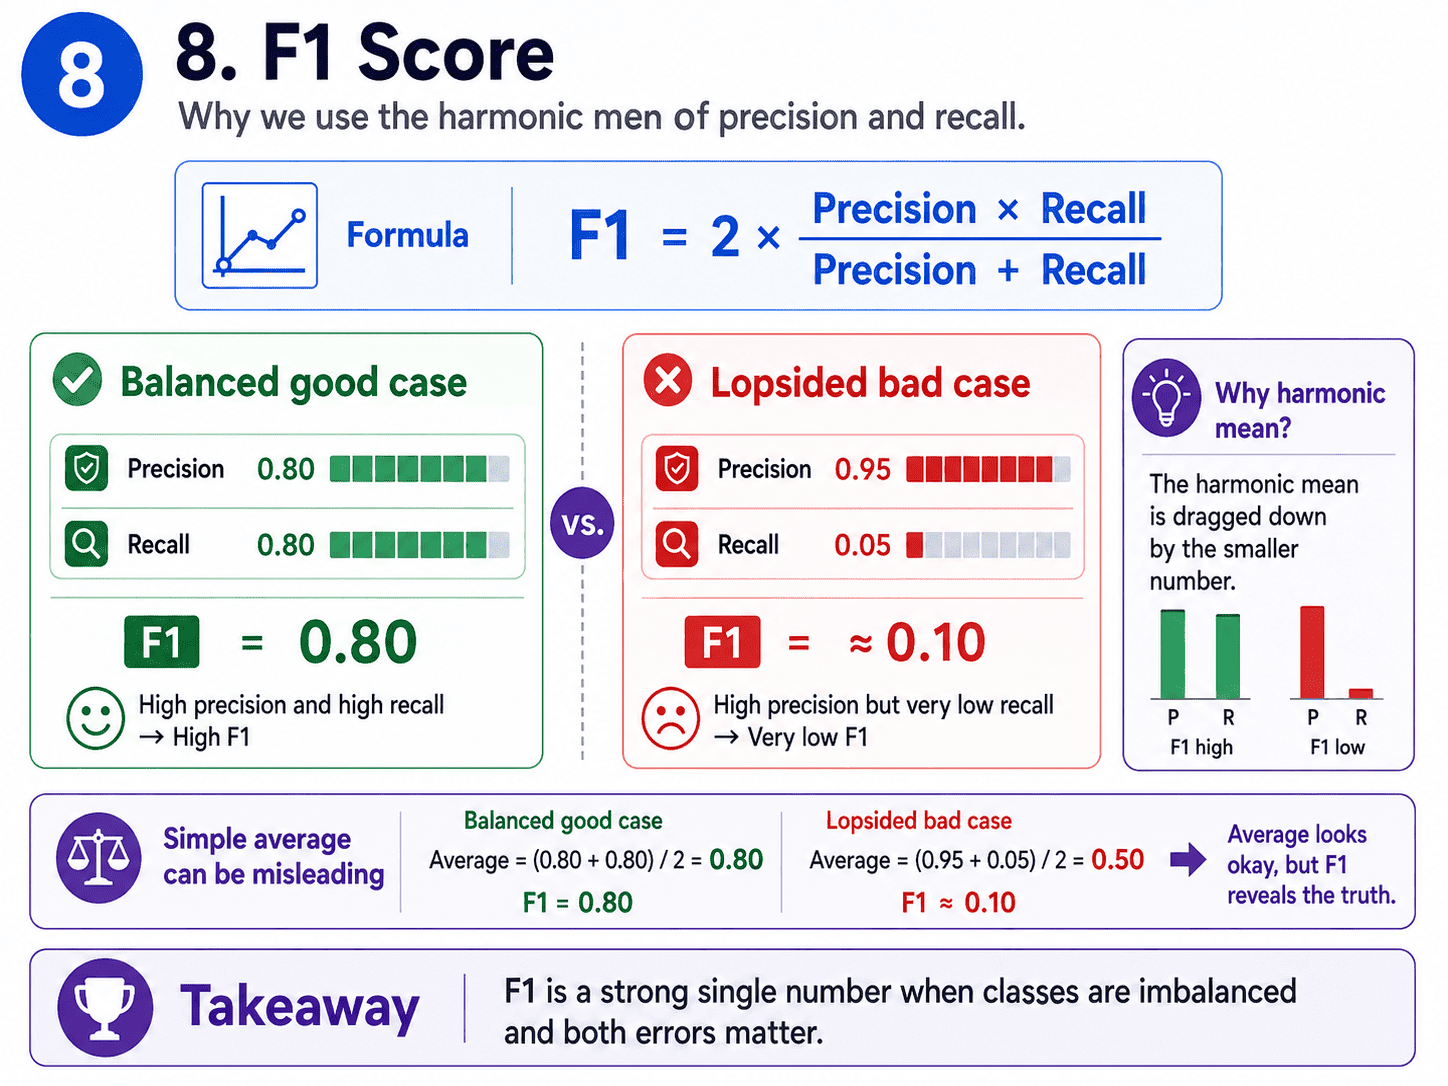
When we do not have a clear preference between precision and recall, we combine them using the harmonic mean.
F1 = 2 × (Precision × Recall) / (Precision + Recall)
F1 is high only when both precision and recall are high. It is brutal on lopsided scores.
For example, precision 0.95 and recall 0.05 gives F1 of about 0.1, which is honest about how bad that model actually is. A good single number for imbalanced classification problems.
9. ROC-AUC:
Instead of fixing a single threshold, ROC-AUC asks "how well does the model rank positives above negatives?" The ROC curve plots the True Positive Rate vs the False Positive Rate as we sweep the threshold from 0 to 1.
The AUC (Area Under the Curve) summarises that curve into one number.
- AUC = 1.0 is perfect ranking.
- AUC = 0.5 is random guessing (the diagonal line).
- AUC = 0.0 is perfectly wrong (literally invert the model to get a perfect one).
ROC-AUC is threshold-independent, which makes it useful for comparing models when we have not fixed a cut-off yet.
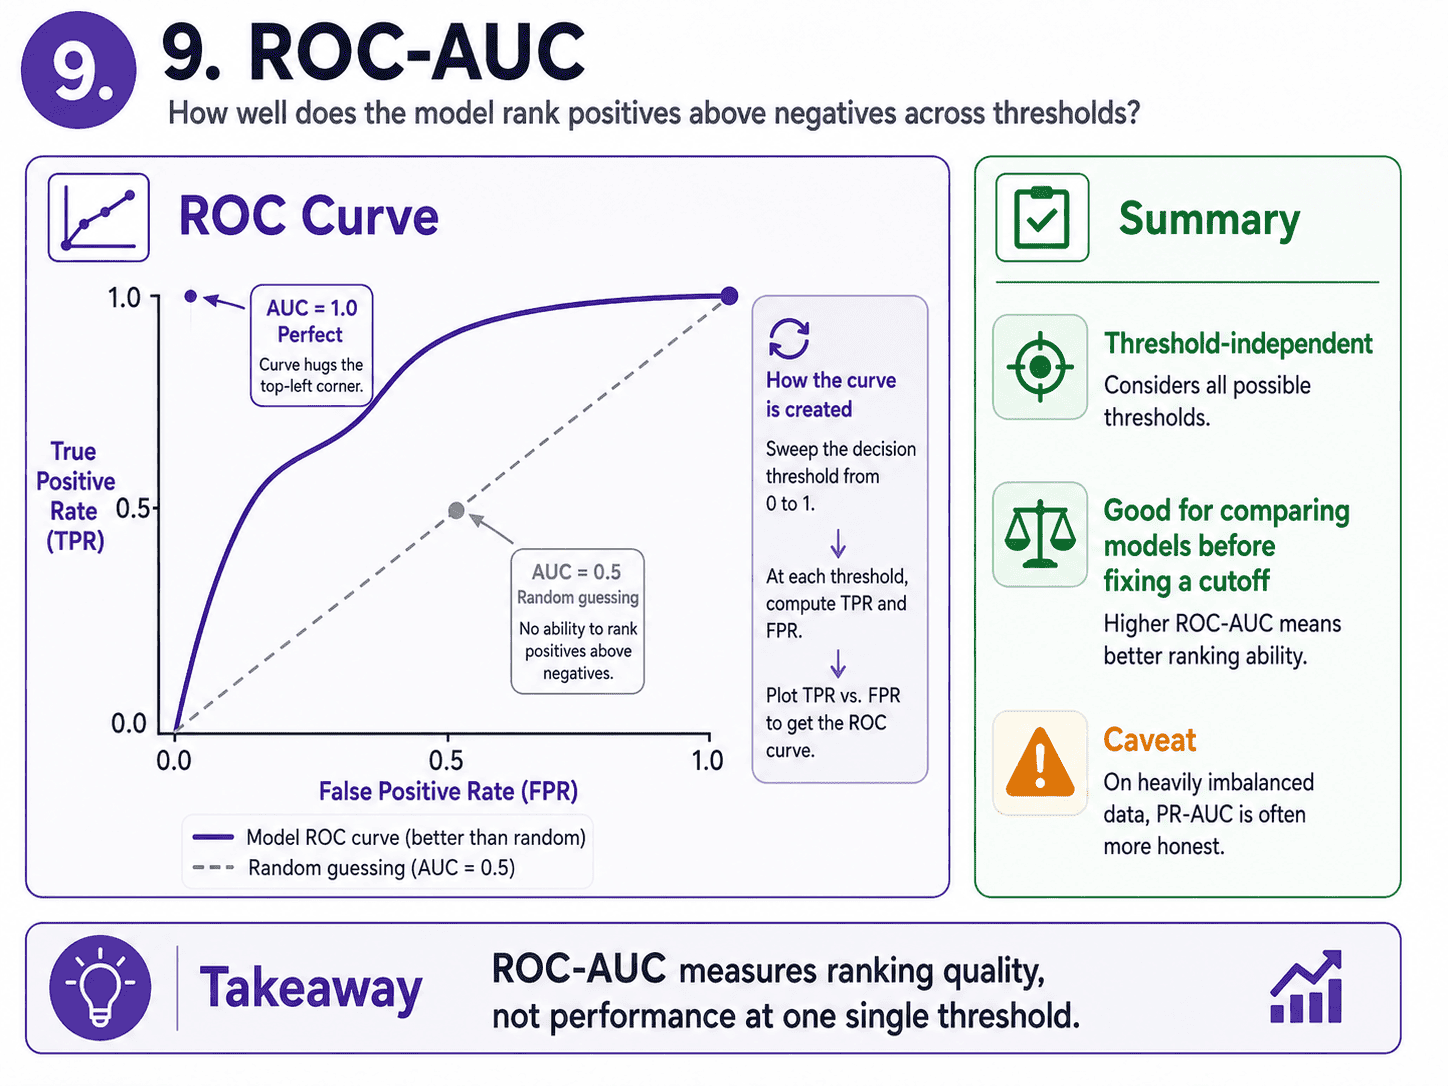
A small caveat. On heavily imbalanced data, Precision-Recall AUC is often more honest than ROC-AUC. We will revisit this on Day 11 Class Imbalance — Why Accuracy Lies.
10. The Code:
from sklearn.metrics import (
    mean_absolute_error, mean_squared_error, r2_score,
    accuracy_score, precision_score, recall_score, f1_score,
    confusion_matrix, roc_auc_score, classification_report
)

# Regression
print(mean_absolute_error(y_true, y_pred))
print(r2_score(y_true, y_pred))

# Classification
print(confusion_matrix(y_true, y_pred))
print(classification_report(y_true, y_pred))     # precision, recall, F1 in one shot
print(roc_auc_score(y_true, y_proba))             # uses probabilities, not labels
The classification_report is the most useful one-liner. It gives precision, recall, and F1 per class.
11. Choosing the Right Metric:
| Problem type | Use this |
|---|---|
| Regression, interpretable error | MAE |
| Regression, big errors hurt more | RMSE |
| Regression, "% variance explained" | R² |
| Classification, balanced classes | Accuracy, F1 |
| FP very costly (spam, fraud alerts) | Precision |
| FN very costly (cancer, fire alarms) | Recall |
| Imbalanced, both matter | F1, PR-AUC |
| Compare models, no fixed threshold | ROC-AUC |
A small thought to sit with. Imagine a medical screening model has 99.5% accuracy, but the disease only affects 1 in 200 people.
What metric should we really be looking at? Recall. With a 1-in-200 base rate, we can hit 99.5% accuracy just by saying "no" to everyone.
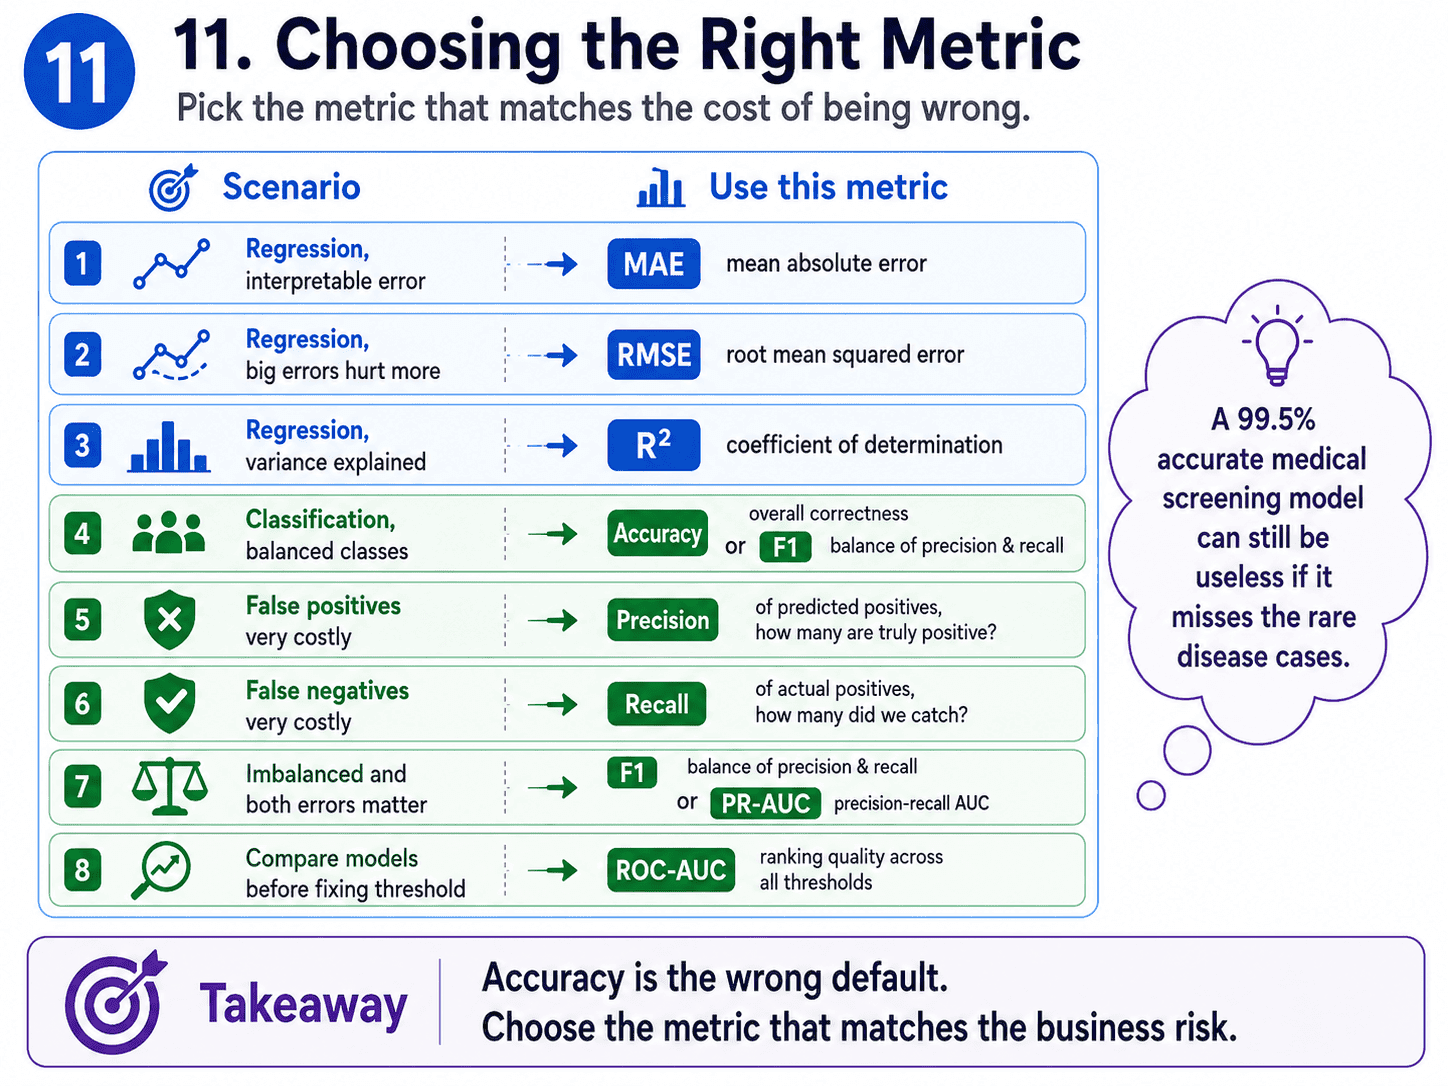
The metric must reward catching the rare yeses, not piling on easy nos.
12. A Few Common Confusions Cleared:
- Why is F1 a harmonic mean and not just an average? Because the harmonic mean is dragged down by the smaller number. A regular average of precision 1.0 and recall 0.0 is 0.5, which is misleading. F1 in that case is 0, which is much more honest.
- What is "macro" vs "micro" vs "weighted" averaging? Macro averages each class equally. Micro averages every individual prediction. Weighted weighs by class size. On imbalanced data, macro F1 is usually what we want, because it stops the majority class from dominating.
- Should I always optimise the same metric I report? Ideally yes, but it is not always possible. Some metrics (like F1) are not smoothly optimisable. We typically train on log loss or MSE, but evaluate on the business metric.
- Accuracy vs precision, what is the difference? Accuracy is overall correctness. Precision is correctness only on what we flagged as positive.
- Common interview question: "You have 95% accuracy. Is that good?" The expected answer is "depends on the class balance." Always ask about the base rate.
13. If This Came In An Interview:
A few questions to be ready for, with one-line answers.
- Why is accuracy a bad metric on imbalanced data? Because saying "majority class" to everything gives high accuracy without learning anything. On a 99/1 imbalance, a useless model scores 99%.
- Precision vs Recall in one line each? Precision is "when I say yes, am I right?". Recall is "of all real yeses, how many did I catch?".
- When would you use Precision over Recall? When false positives are expensive: spam filters, fraud accusations, costly interventions. We want to trust every "yes."
- When would you use Recall over Precision? When false negatives are expensive: cancer screening, fire alarms, anything where missing a real case is catastrophic.
- What is F1 and when do you use it? Harmonic mean of precision and recall. Good single number when classes are imbalanced and both errors matter.
- What is ROC-AUC and what does AUC = 0.5 mean? Area under the curve plotting True Positive Rate vs False Positive Rate as the threshold varies. 0.5 means random guessing, 1.0 is perfect.
- ROC-AUC vs PR-AUC, when to use which? ROC-AUC for roughly balanced classes. PR-AUC for heavily imbalanced classes, because it focuses on the rare class.
- MAE vs MSE vs RMSE? MAE is robust to outliers. MSE punishes big errors more (squared). RMSE is MSE in original units, common in industry reporting.
- What does R² = 0.85 mean? The model explains 85% of the variance in y. R² = 1 is perfect, 0 is no better than predicting the mean.
14. Summing It Up:
If we remember one thing from today, it is this:
accuracy is the wrong default. Pick the metric that matches the cost of being wrong. Precision asks "can I trust a yes?".
Recall asks "did I catch all the yeses?".
F1 combines both.
R² tells us how much variance the model explains.
And the confusion matrix is the parent of every classification metric.
Coming Up on Day 7: Gradient Descent — How Models Actually Learn
We have talked about models being "trained" without explaining how. Tomorrow we lift the bonnet on the engine that powers almost every ML algorithm: Gradient Descent. No calculus, just the intuition every interviewer expects us to have.
That's all for today. Let's meet up again tomorrow with Day 7.
Thanks for reading.
Cheers!